TL;DR
GIS (Geographic Information System) is software and data that links information to a place on the map, so you can see, query, and analyse it spatially rather than as rows in a spreadsheet. It's used anywhere the answer to a question depends on where something is.
Every organisation collects data. Most of it, at some point, has a location attached: an address, a site, a boundary, a route. GIS is what happens when you stop treating that location as just another column in a spreadsheet and start treating it as the thing that connects everything else.
The short definition
A Geographic Information System (GIS) is software and data that links information to a specific place, so you can see it, query it, and analyse it spatially. Instead of a list of addresses, you get a map where each address is a point you can filter, colour, measure, and compare against other layers, like flood zones, planning boundaries, or transport routes.
The “system” part matters. GIS isn’t one piece of software. It’s the combination of data (the spatial layers themselves), tools (QGIS, ArcGIS, PostGIS, and others), and the people who know how to ask the right questions of both.
The same three letters also stand for Geographic Information Science: the academic field behind the software, covering spatial statistics, cartographic theory, and how spatial data should be modelled in the first place. Most people mean the system when they say GIS. Worth knowing the other meaning exists, mainly so you’re not thrown when a university course or a research paper uses it.
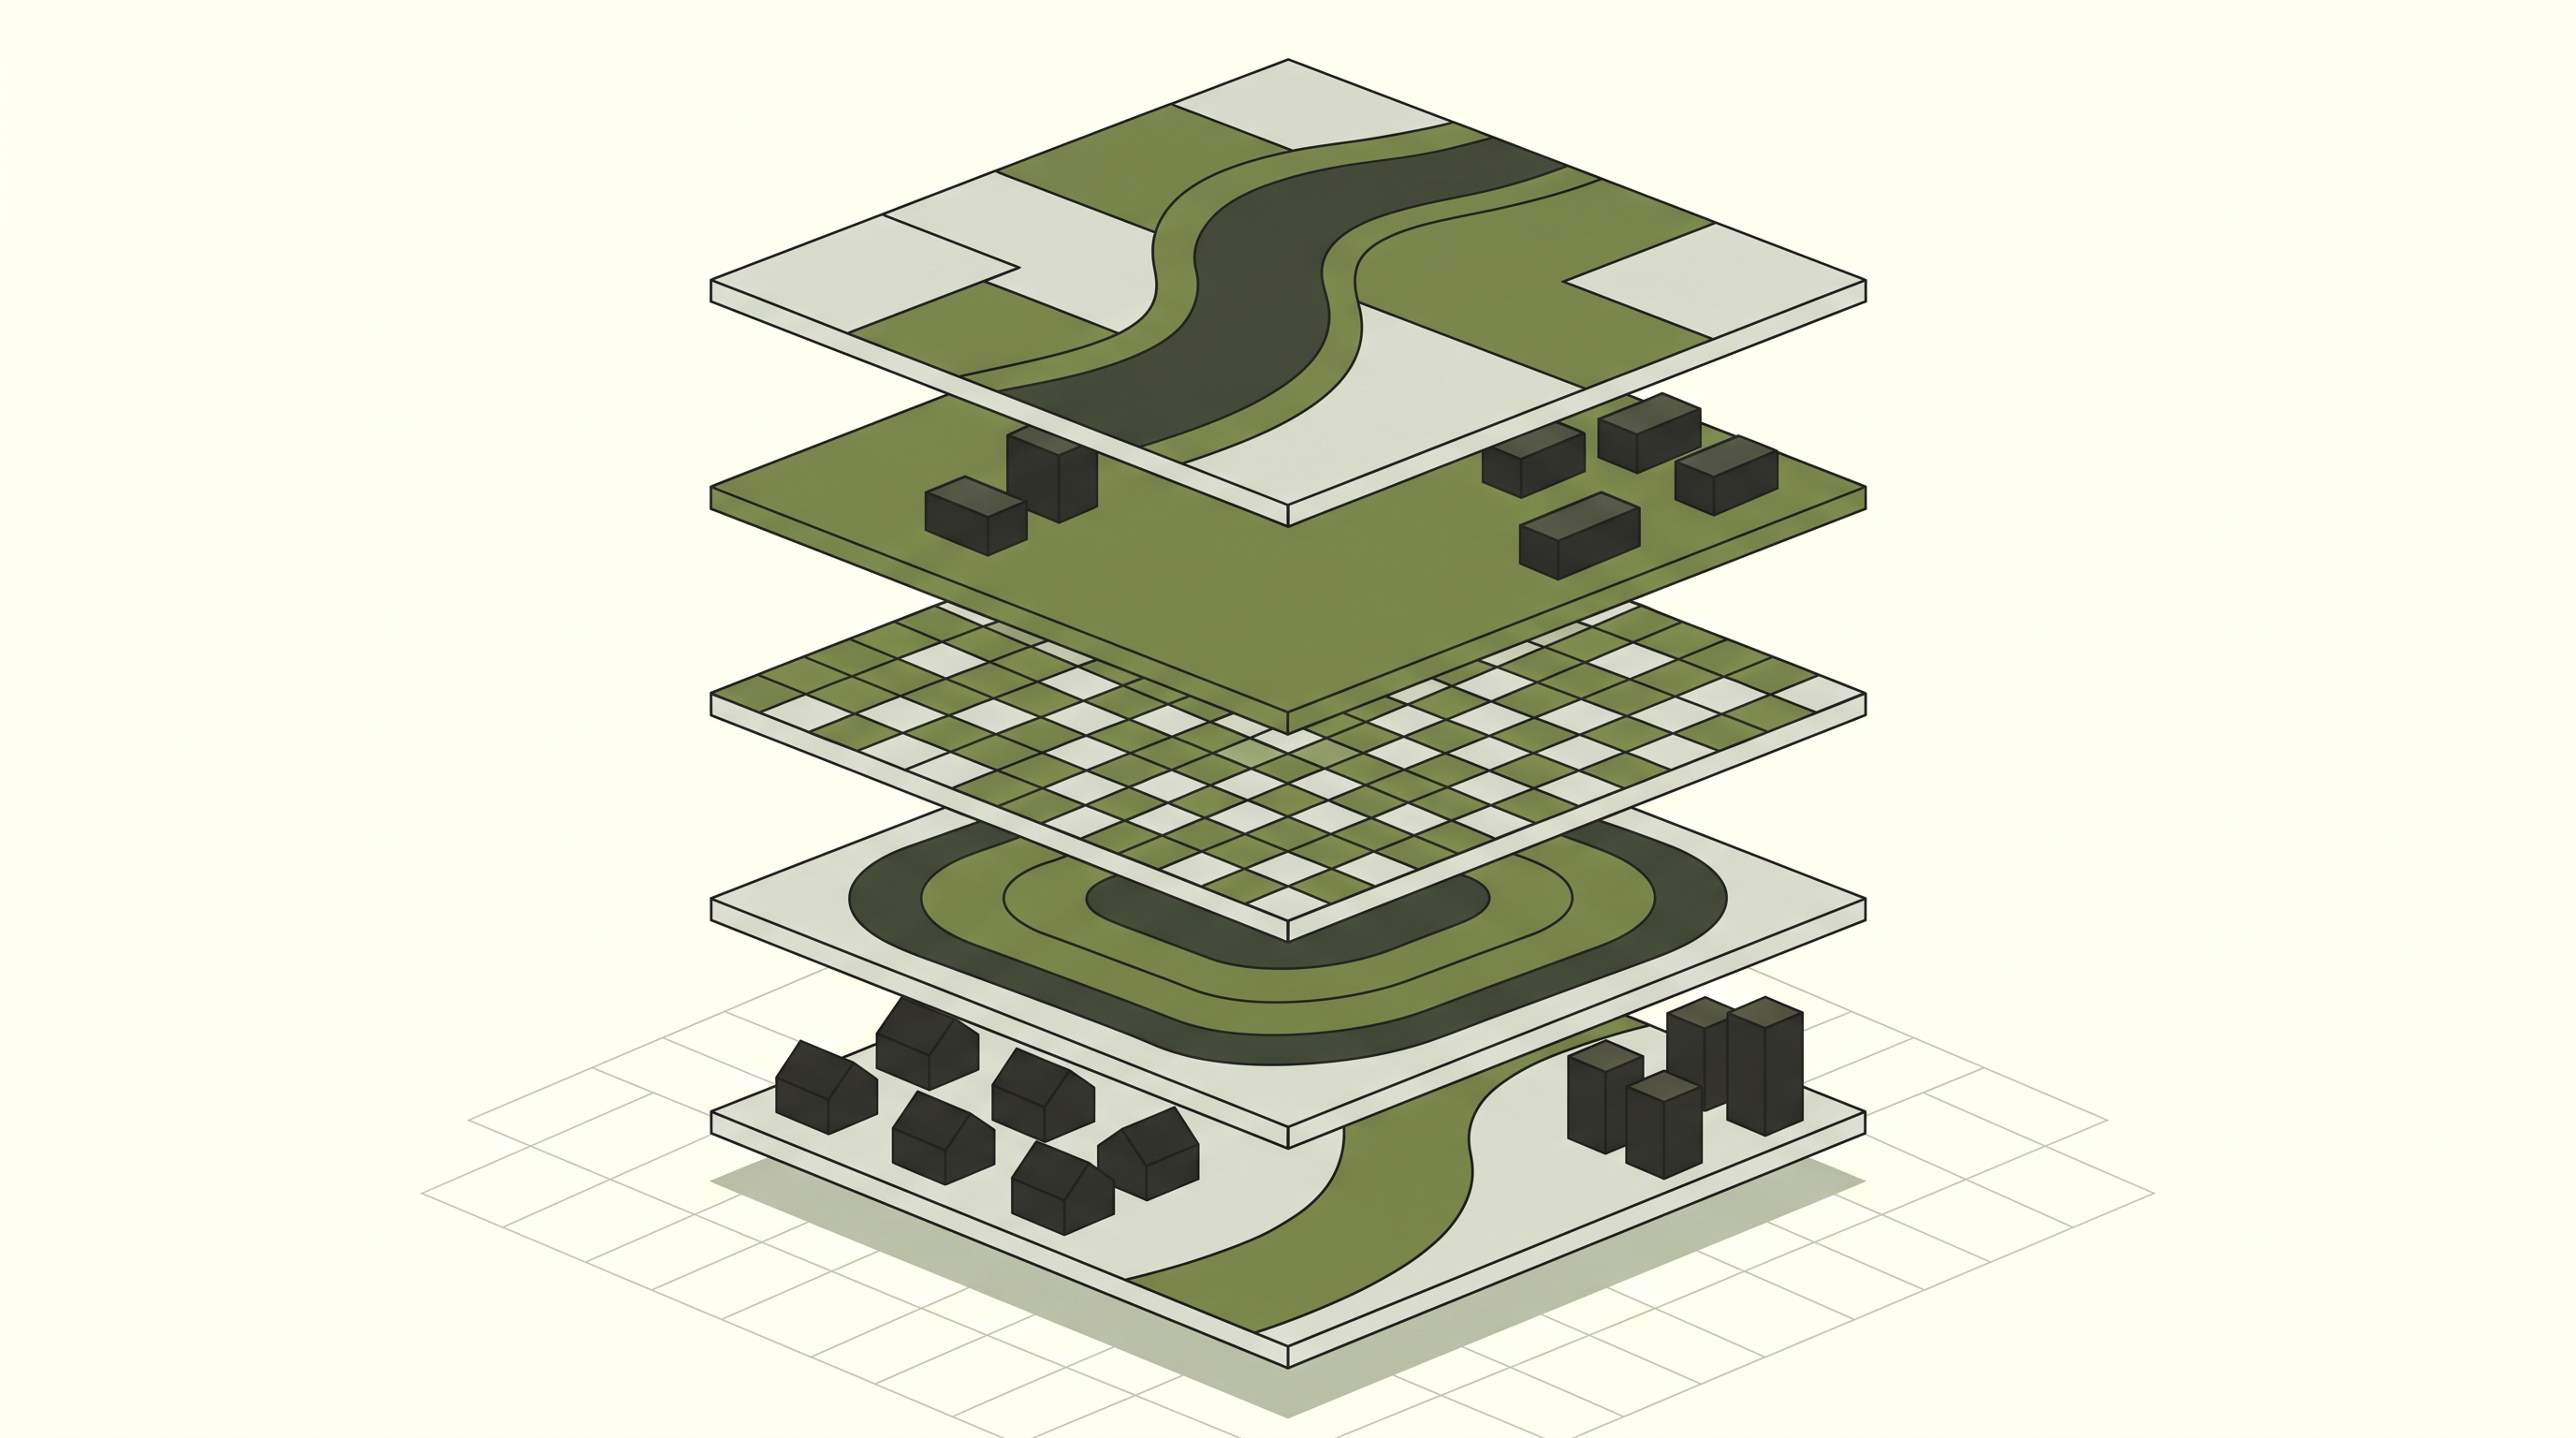
A GIS project as a stack of layers: terrain, assets, land use, spatial analysis, and the real-world view they all sit on top of.
What GIS actually does
Strip away the jargon and GIS does four things:
Stores data with a location attached, usually as coordinates, a boundary, or a route, alongside whatever attributes describe it (an address, an owner, a value, a date). A housing association’s stock list stops being a spreadsheet of postcodes and becomes a set of points you can map against flood zones, deprivation scores, or planned works.
Displays that data as a map, so patterns that are invisible in a spreadsheet, like clustering, proximity, or overlap, become obvious at a glance. Twenty boiler breakdowns scattered through a spreadsheet look like twenty unrelated rows. On a map, they might all sit on the same estate built in the same decade.
Queries the data spatially. Not just “show me all sites over 2 hectares” but “show me all sites over 2 hectares within 500m of a substation and outside a flood zone.” That’s three conditions a spreadsheet filter can’t combine, because two of them depend on where the site sits relative to something else.
Analyses relationships between layers: what falls inside a boundary, what’s nearest to what, how something has changed over time. A local authority checking a planning application against a conservation area boundary, a tree preservation order, and a flood risk layer in one pass is doing exactly this.
That last point is the one that separates GIS from a map. A map shows you where things are. GIS lets you ask why, and what else is true about that place.
The map that started it
In 1854, London physician John Snow was trying to work out why cholera kept killing people in Soho, at a time when most doctors blamed “bad air” rather than water. Instead of working through a list of deaths, he put each one on a street map, plotted by address.
The pattern wasn’t visible in the death records. It was visible on the map. Cases clustered tightly around a single water pump on Broad Street. Snow had turned a list into a spatial question: which households are nearest which pump? The answer pointed straight at the water supply, not the air, and helped convince local officials to disable the pump.
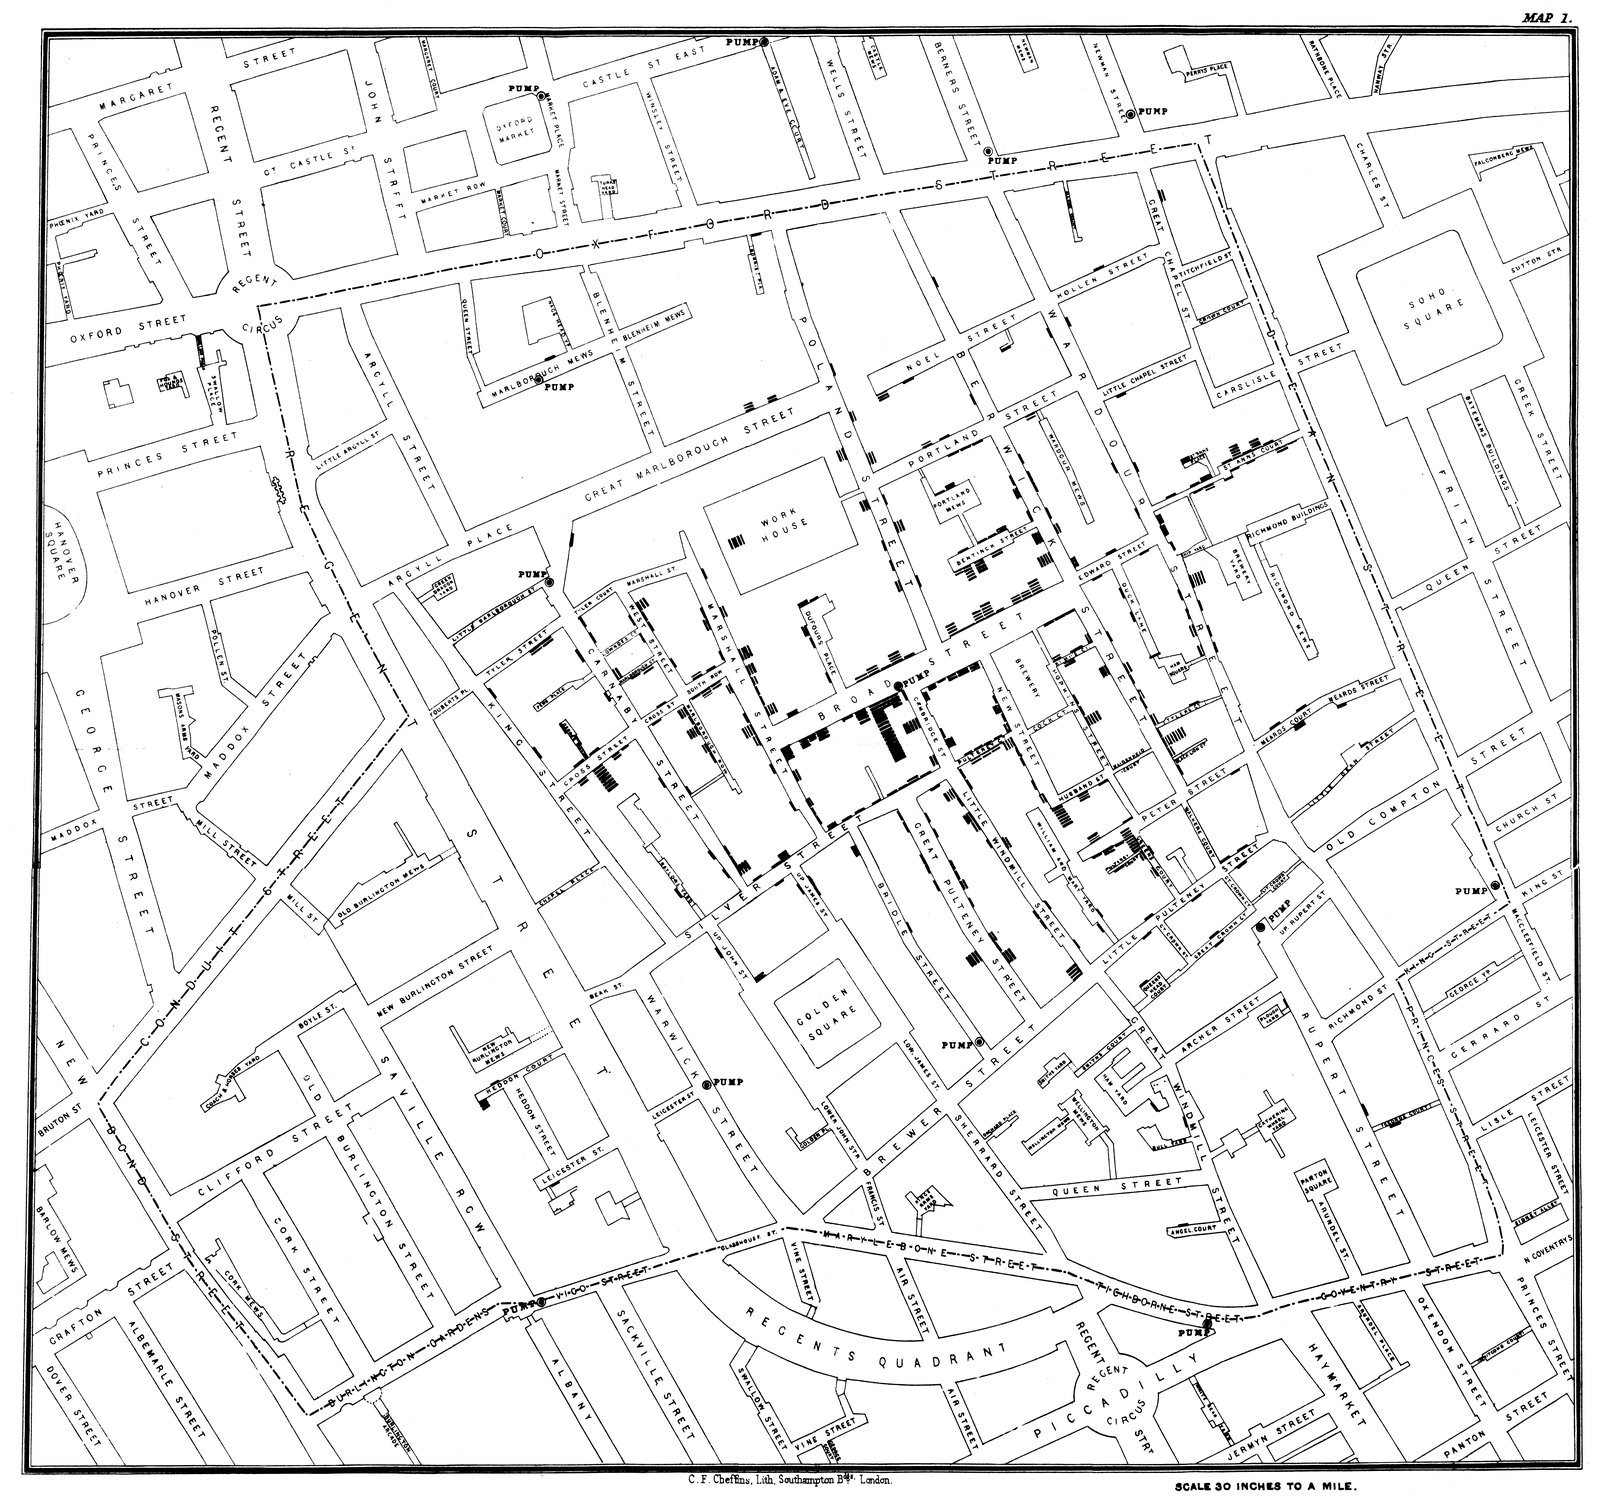
Snow's original 1854 map. Each black bar is a death, stacked outward from the building where it happened. Source: Wikimedia Commons, public domain.

Snow had no software. He had a paper map, a list of addresses, and a question worth asking spatially. That’s still the core of GIS today: a table of coordinates doesn’t tell you anything on its own. The map is what turns it into an answer, which is why Snow’s cholera map is widely cited as one of the first examples of spatial analysis, decades before “GIS” existed as a term.
Where the data comes from
GIS runs on two broad types of data: discrete features and continuous surfaces. Discrete data is anything you’d draw as a distinct shape: a property boundary, a pipe network, a single tree, a planning application site. Continuous data is anything that varies smoothly across space with no natural edges: elevation, temperature, rainfall, or a flood depth model. Most real projects use both, layered on top of each other, which is exactly what our vector vs raster breakdown covers in more depth.
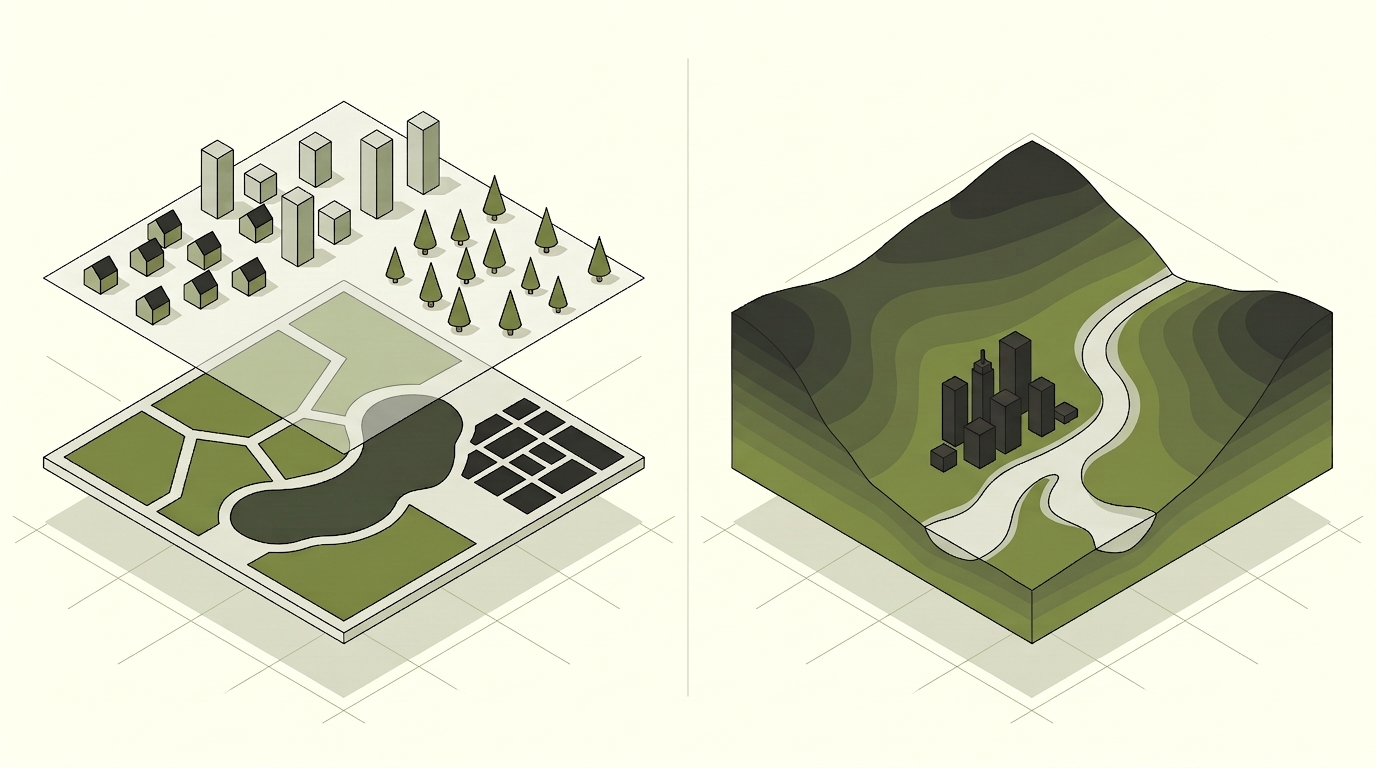
Left: discrete data, distinct shapes like parks, water, and buildings. Right: a continuous surface, like elevation, with no natural edges.
That data has to sit somewhere consistent, in a shared map projection and coordinate system. Get the coordinate system wrong and two accurate datasets can end up miles apart on the same map.
Who uses it, and for what
GIS shows up in more places than most people expect:
- Property and land: matching title boundaries against ownership records to screen a site for feasibility before anyone commits budget to it
- Local government: checking a planning application against every constraint layer that could block it, in one query instead of a dozen separate lookups
- Utilities and infrastructure: mapping a pipe or cable network so an outage can be traced to the right junction instead of the whole street
- Energy and renewables: scoring candidate sites against terrain, grid connection distance, and planning constraints before a single survey is commissioned
- Environment and conservation: tracking habitat boundaries and flood risk over time to see what’s actually changing, not just what a single survey caught
If your organisation manages land, assets, routes, or anything else with a physical location, there’s a decent chance GIS is already relevant, whether or not you’re using it yet. Not sure if you’ve got the internal skills to run with it, or whether you need to bring someone in? What does a GIS consultant actually do and has GIS, or no GIS both walk through that decision.
Getting started
You don’t need an enterprise rollout to benefit from GIS. Many organisations start small: a single dataset cleaned up and put on a map, a one-off site selection project, or a QGIS setup for an in-house analyst. The tooling scales from free and open-source (QGIS, PostGIS) through to enterprise platforms (ArcGIS Online, ArcGIS Enterprise), so the right starting point depends on your budget, your data, and what you’re trying to answer.
If you’re weighing that up, our ArcGIS vs QGIS comparison is a good next read, or get in touch and we’ll help you figure out where to start.