TL;DR
A map projection is a mathematical method for representing the Earth's curved surface on a flat plane, always trading off some combination of area, shape, distance, or direction. A coordinate reference system (CRS) defines how locations are measured within it, and in Great Britain the standard for most work is British National Grid (EPSG:27700).
The Earth is roughly spherical. Every map you’ve ever looked at is flat. Getting from one to the other requires a compromise, and that compromise is a map projection.
Every mapping course covers this in week one, and it still catches people out years later. It’s why two perfectly good datasets refuse to line up, and why an area measured on a web map can come out at more than twice its real size. If you’re new to all this, start with What is GIS? and come back.
Why you need a projection at all
You cannot flatten a curved surface onto a plane without distorting something. Peel an orange and try to lay the peel flat: it tears, stretches, or overlaps. Cartographers have the same problem with the Earth, only with maths instead of orange peel.
Every projection picks which distortion to accept:
- Equal-area projections preserve area accurately but distort shape (useful for comparing land sizes)
- Conformal projections preserve shape and angles locally but distort area (useful for navigation)
- Equidistant projections preserve distance from a central point but not elsewhere
- No projection preserves area, shape, distance and direction all at once. It can’t be done
So the choice always has to match the purpose. A projection built for global navigation is the wrong one for working out the area of a housing site, and the other way round.
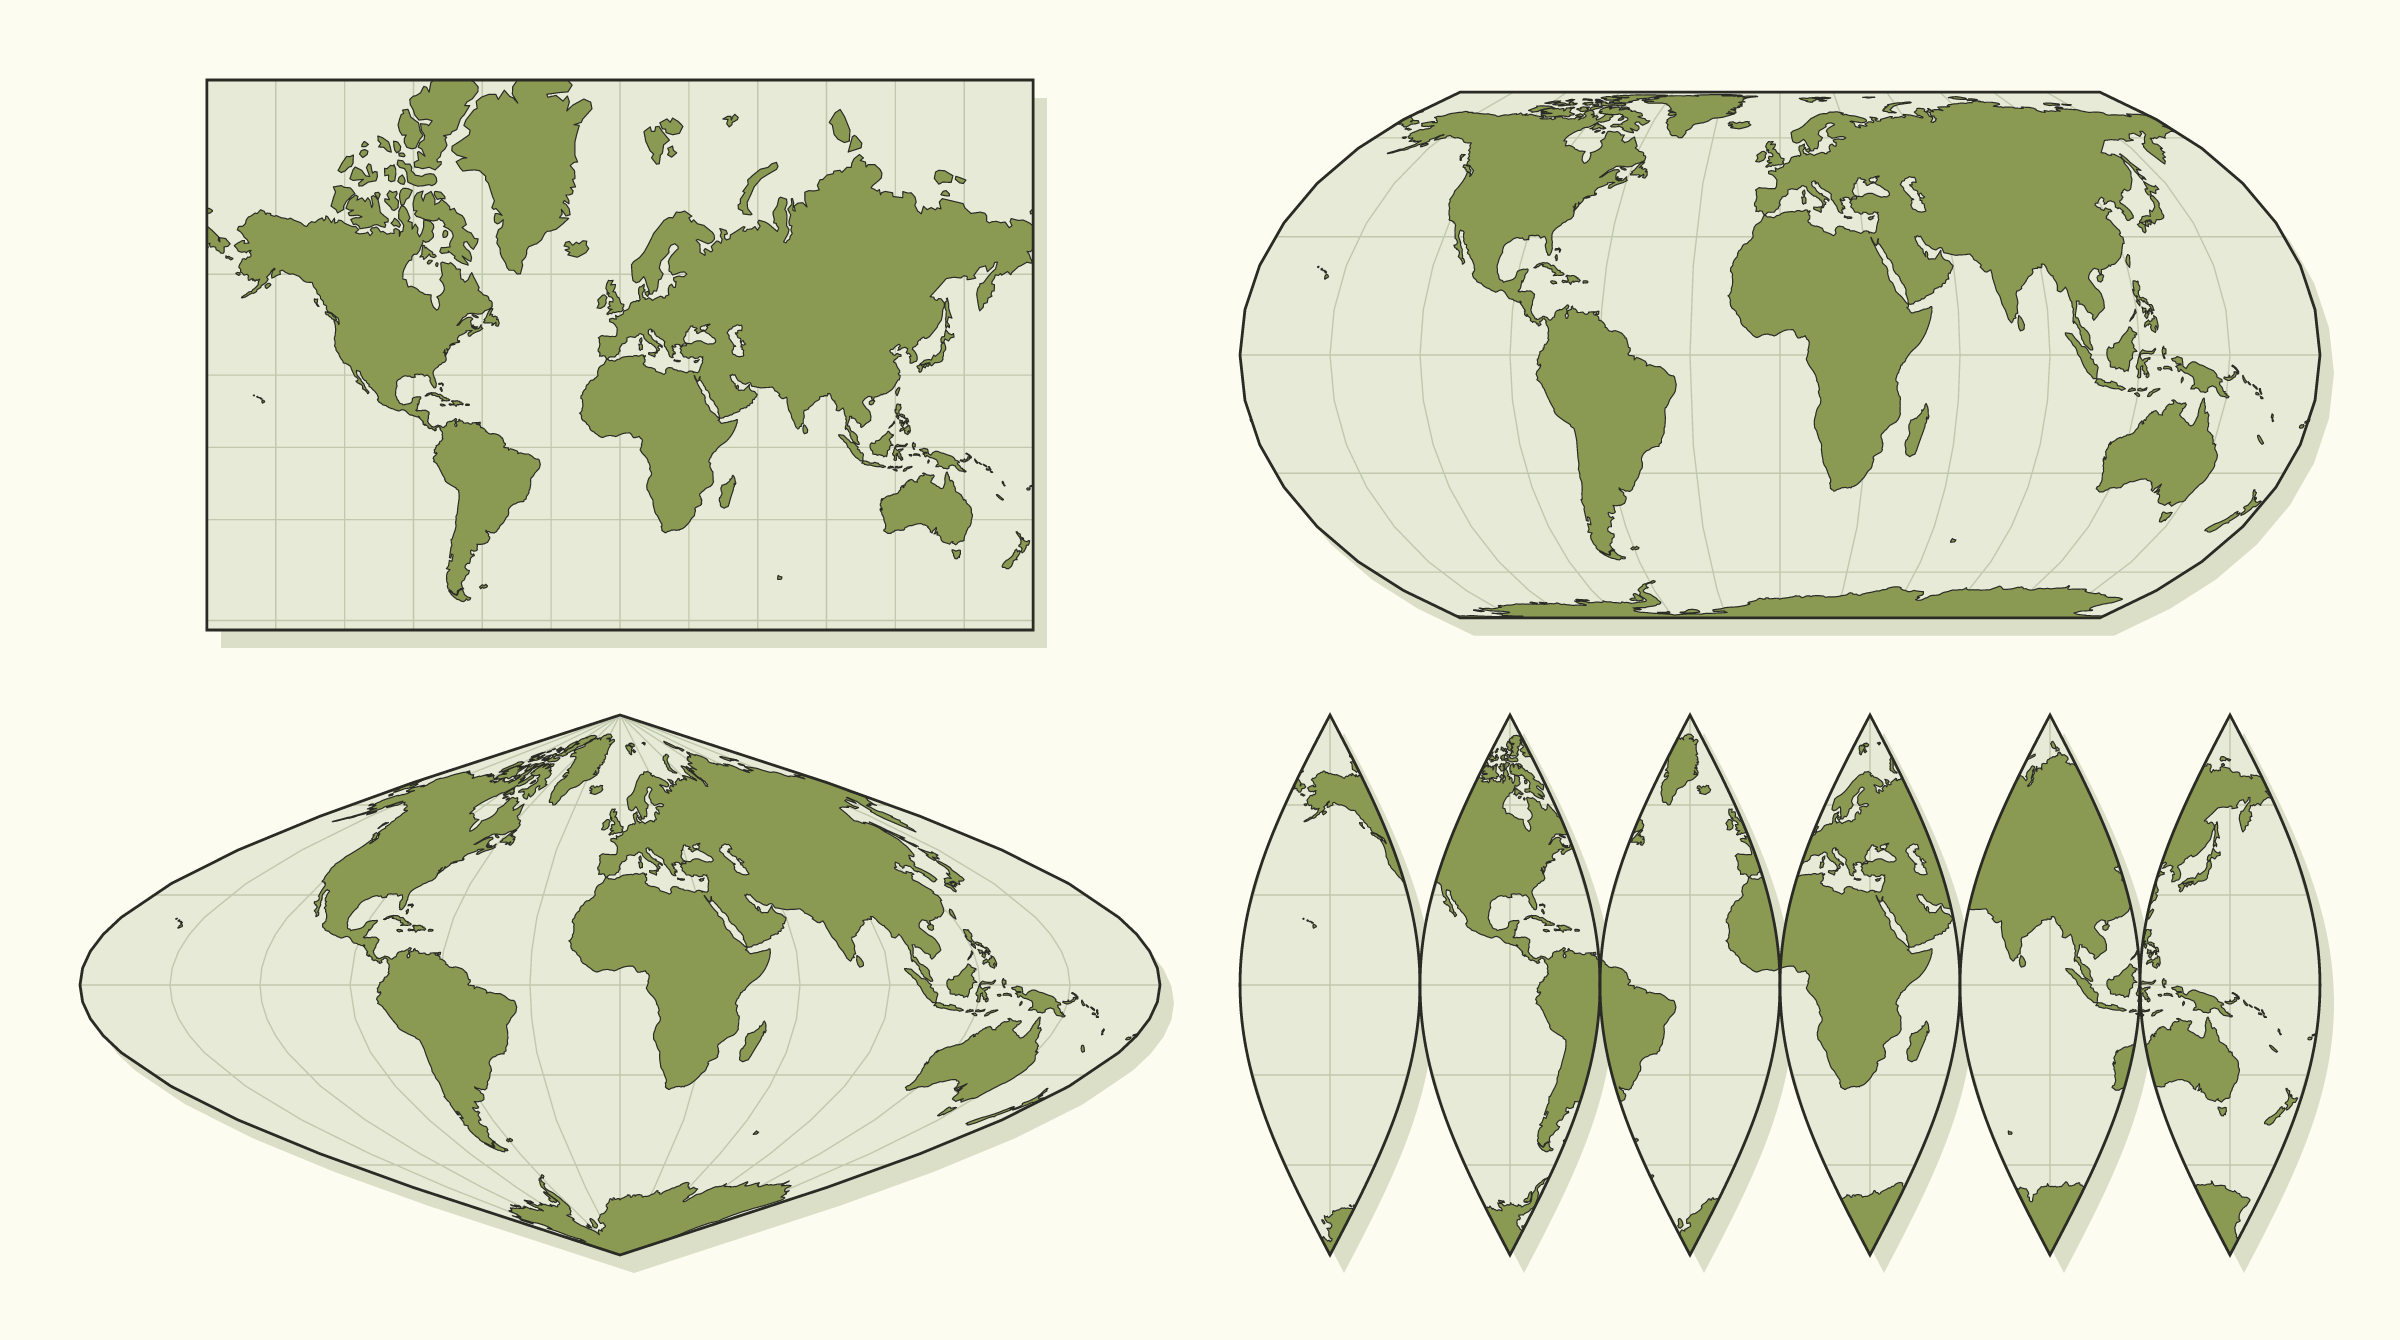
The same world in four projections. Clockwise from top left: Mercator, Equal Earth, interrupted sinusoidal (the flattened orange peel), and sinusoidal. Compare Greenland with Africa in each one.
The Mercator problem
The best-known example is Mercator. Gerardus Mercator published it in 1569 for sailors, because a straight line on his map is a constant compass bearing at sea. To manage that, it stretches everything more and more the further you get from the equator.
The side effect is the world map most of us grew up with, where Greenland looks about the same size as Africa. Africa is roughly 14 times larger. Mercator is brilliant for navigation and terrible for a wall map of the world.
It isn’t only a classroom problem, because almost every web map you use runs on a close relative called Web Mercator (EPSG:3857). Google Maps and OpenStreetMap both use it. It keeps shapes looking right as you zoom in, and it lets the world be cut into neat square tiles.
Web maps can keep it, that’s what it’s for. The trouble starts when you measure with it. At the latitude of Essex, Web Mercator stretches distances by a factor of about 1.6, so areas come out roughly 2.6 times too big. Measure a one-hectare field straight from Web Mercator coordinates and you get about 2.6 hectares. Most GIS software corrects for this without telling you. A home-made script or a spreadsheet formula won’t.
Projection vs coordinate reference system
“Projection” and “coordinate reference system” (CRS) get used interchangeably, but a CRS is the more complete idea. It specifies:
- The projection (or lack of one, for unprojected geographic coordinates like latitude/longitude)
- The datum, which is the model used to approximate the Earth’s actual shape (the Earth isn’t a perfect sphere, so different datums fit different regions more accurately)
- The units and origin used to measure locations, such as metres from a defined starting point
Two datasets can share a projection, sit on different datums, and still not line up. You need the whole CRS to match.
Geographic vs projected coordinates
Coordinate reference systems come in two types, and knowing which one you’re looking at clears up a lot of the confusion.
A geographic CRS describes a position on the curved Earth using angles: latitude and longitude, in degrees. It hasn’t been flattened at all. This is what a phone or GPS receiver gives you.
A projected CRS describes a position on a flat grid using distances: eastings and northings, usually in metres. It has been through a projection.
You notice the difference as soon as you measure anything, because a degree isn’t a fixed length. One degree of longitude is about 111 km at the equator, about 69 km across southern England, and nothing at all at the poles. Try drawing a 500 metre buffer in degrees and you’ll see the problem. On a grid measured in metres it’s simple arithmetic.
You can usually tell the two apart by looking at the numbers. Chelmsford in latitude and longitude is roughly 51.73, 0.47. The same place on the British National Grid is roughly 570800, 206900. Small numbers with decimals are degrees. Six-figure numbers are almost certainly metres.
British National Grid: the UK standard
For most GIS work in Great Britain, the standard coordinate reference system is British National Grid, identified by the code EPSG:27700. It’s the CRS used throughout Ordnance Survey data, and it measures locations as eastings and northings in metres from an origin placed out to sea, south-west of the Isles of Scilly. Putting the origin there means every coordinate on the British mainland is a positive number.
British National Grid is a projected CRS, which means distances and areas can be calculated directly from the coordinates without further conversion. That’s why it’s the default for planning, land, and infrastructure work across Great Britain.
Two things are worth knowing about it:
- It covers Great Britain only. Northern Ireland uses the Irish Grid (EPSG:29903) or Irish Transverse Mercator (EPSG:2157).
- It sits on its own datum, called OSGB36, which is not the same as the one GPS uses. The same latitude and longitude describes two points roughly 100 metres apart depending on which datum you mean. That gap causes a lot of the “nearly right” errors further down.
The codes you’ll actually meet
Every CRS has an EPSG code, a reference number from a public registry that software uses to identify it. There are thousands of them. In UK work you’ll mostly see three:
| EPSG code | Name | Units | Where you’ll meet it |
|---|---|---|---|
| 27700 | British National Grid | Metres | Ordnance Survey data, planning, land and infrastructure work |
| 4326 | WGS84 | Degrees | GPS, phones, most spreadsheets of latitude and longitude, GeoJSON |
| 3857 | Web Mercator | Metres, stretched | Google Maps, OpenStreetMap and other web map backgrounds |
Most of the free datasets we list in our guide to open data in the UK arrive in the first of these. Most things that have been through a phone, a web form, or a web map arrive in the second.
Where this goes wrong in practice
People rarely pick a bad projection. Far more often the CRS is missing or mismatched. A dataset gets loaded without its CRS correctly defined, and the software either guesses wrong or plots it somewhere it doesn’t belong. Two accurately surveyed layers can end up a few metres apart, or on different continents, and the data itself is fine.
How far out the data lands usually tells you what went wrong:
- Everything piled up in the sea off Cornwall. Latitude and longitude values have been read as British National Grid metres. A longitude of 0.47 becomes 0.47 metres from the grid’s origin, so every record lands within a few metres of it.
- Points off the coast of West Africa. The coordinates are blank or zero, which plots at latitude 0, longitude 0 in the Gulf of Guinea. GIS people call it Null Island.
- Points in the wrong country, or mirrored. Latitude and longitude have been swapped. Different file formats disagree about which comes first.
- Everything about 100 metres out. A datum mismatch, typically GPS coordinates treated as if they were on the Ordnance Survey datum, or the reverse.
- A few metres out. The right systems, but a rough conversion between them. For Great Britain, Ordnance Survey publishes a precise transformation called OSTN15, and modern software will use it if it’s installed.
A worked example
Say a team has a spreadsheet of 300 site locations captured on phones, with latitude and longitude columns, and wants to check them against Ordnance Survey boundary data in British National Grid.
The file is loaded into the GIS. A CSV carries no information about its coordinate system, so the software asks, and someone picks the project default, EPSG:27700. Every site vanishes. Zooming to the layer shows 300 points in a tiny cluster in the Atlantic.
It’s tempting to keep changing the layer’s CRS setting until it looks right. The proper fix is two separate steps:
- Tell the software what the coordinates really are. They were captured as latitude and longitude, so the layer is defined as EPSG:4326. The points jump to the right places.
- Convert the data to the system you want to work in. The layer is reprojected to EPSG:27700 and saved as a new file. The numbers themselves change, from degrees to metres.
Now the sites sit on the boundaries, and you can trust the distances and areas.
Defining vs reprojecting
That example depends on a difference that catches most people out at least once.
Defining a CRS is labelling. It tells the software how to interpret the numbers already in the file, and changes nothing about the data. You do it when the label is missing or wrong.
Reprojecting is converting. It recalculates every coordinate into a different system and writes out new data. You do it when the label is right but you need the data in another system.
The classic mistake is defining when you needed to reproject. The label now says British National Grid, the numbers are still degrees, and the next person to open the file has no way of knowing.
In QGIS, defining is “Set Layer CRS” and reprojecting is the “Reproject Layer” tool, or exporting the layer with a different CRS. In ArcGIS Pro, they are the “Define Projection” and “Project” tools. Whichever you use (we compare them in ArcGIS vs QGIS), both will also reproject layers on the fly so that they display together. That’s handy, but it also means a mismatch can sit there unnoticed until someone runs a measurement.
What to check before you trust a dataset
When a spatial dataset “doesn’t line up” with everything else, check the CRS before assuming the data is wrong:
- Does the file say what CRS it uses? A shapefile keeps this in a separate .prj file, which often goes missing when files are emailed. A GeoPackage stores it internally. A CSV has nothing at all.
- Do the numbers match the label? Six-figure values labelled as degrees, or decimals labelled as metres, mean the label is wrong.
- Does it land where you expect on a background map? It takes thirty seconds to look.
- Is everything in the project in the same system before you measure? For work in Great Britain, that usually means reprojecting to British National Grid first.
- Did you write down what you converted, and how? The next person, possibly you in six months, will need to know.
The same checks apply to both kinds of data covered in vector vs raster. They matter most when you’re moving data between systems, so coordinate systems should get their own line in any GIS data migration plan.
If you’re dealing with datasets from multiple sources that won’t align, get in touch. CRS mismatches are one of the most common problems we see in spatial data audits, and one of the easiest to fix.