TL;DR
Vector data represents distinct features (points, lines, polygons) like a building or a road. Raster data represents continuous surfaces as a grid of cells, like elevation or temperature. Whether your underlying phenomenon is discrete (a fixed boundary) or continuous (a gradient) usually decides which format fits.
Open any GIS project and, underneath the styling and the basemap, every layer is one of two things: vector or raster. Knowing which is which, and why, is the first real building block of working with spatial data. It also decides what you can measure, how big your files get, and how much you can trust the answer.
If you’re new to the subject, What is GIS? covers the bigger picture first.
Vector data: distinct features
Vector data represents things with a clear boundary and identity. A shop, a road, a field, a pipe network. Each feature is stored as coordinates:
- Points are a single x/y location, like a tree, a borehole, or a customer address
- Lines are a sequence of connected points, like a road, a river, or a cable route
- Polygons are a closed shape, like a land parcel, a flood zone, or a local authority boundary
Each feature also carries attributes: a road has a name and a speed limit, a parcel has an owner and an area. That combination of precise geometry and structured attributes is what makes vector data good for questions like “which parcels are within 100m of this pipeline” or “what’s the total area of land zoned for housing in this ward.” One parcel can carry dozens of attributes, and you can filter, sort and join on any of them, much like a spreadsheet with a shape attached to each row.
Because a vector feature is a set of coordinates, it stays sharp however far you zoom in. The edge of a polygon is a mathematical line, so there are no pixels to run out of.
In the UK, most of the data you’d describe as “boundaries” or “networks” is vector: Ordnance Survey administrative boundaries, HM Land Registry’s INSPIRE index polygons, OS Open Roads. It usually arrives as a shapefile, a GeoPackage, or GeoJSON.
Raster data: continuous surfaces
Raster data represents information as a grid of equally sized cells, each with a value. Think of it as a photograph where every pixel means something: elevation, temperature, rainfall, land cover, or the reflectance values in a satellite image.
There’s no individual “feature” in a raster the way there is in vector. There’s a surface of values that changes across space, sometimes gradually and sometimes sharply. That makes raster the right format for things that don’t have a natural edge. Terrain doesn’t stop at a line, and neither does temperature or soil moisture.
A raster can also hold more than one layer of values, called bands. An ordinary photo has three: red, green and blue. Satellite imagery often has more, including infrared bands the eye can’t see, which is how it can be used to pick out healthy vegetation or standing water.
Common UK examples are the Environment Agency’s LIDAR elevation data, aerial photography, and satellite imagery such as Sentinel-2. It usually arrives as a GeoTIFF.
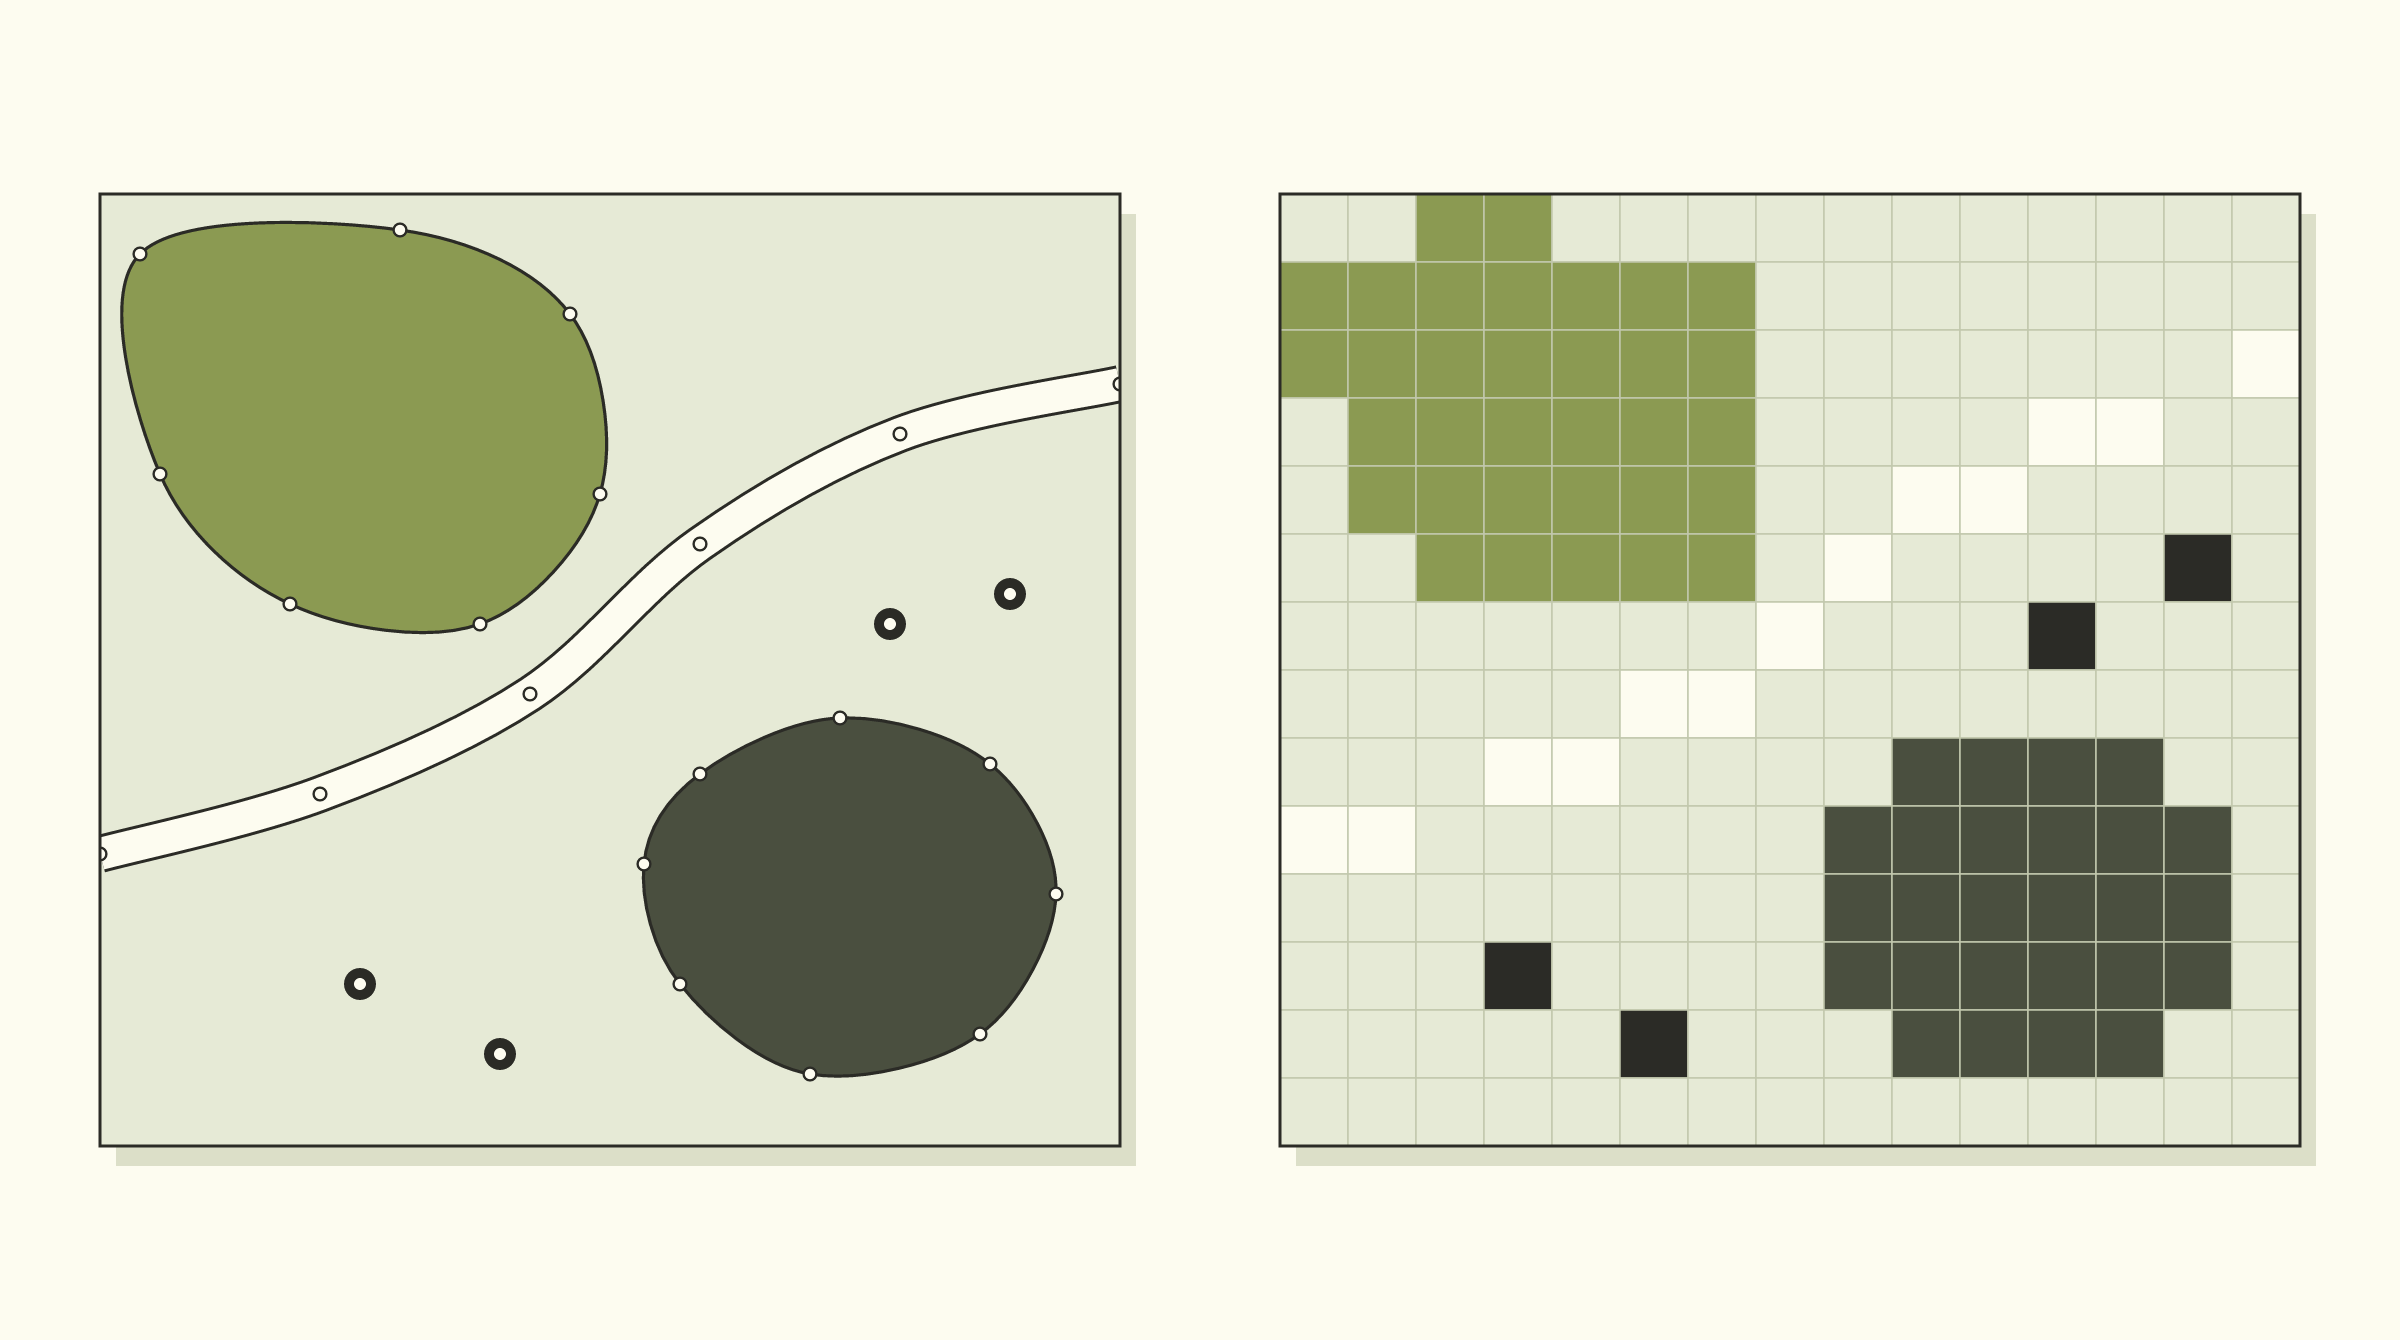
The same scene as vector (left) and raster (right). The shapes get stepped edges, each point becomes a whole cell, and the road breaks up because it is narrower than the cells.
Resolution: the number that matters most in a raster
Every raster has a cell size, also called its resolution. A 1 metre raster has cells that each cover one metre by one metre on the ground. A 10 metre raster has cells covering ten by ten.
That one number sets what the raster can and can’t show. Anything smaller than a cell disappears or gets blended into its neighbours. A hedge two metres wide is clear in 1 metre LIDAR and invisible in 10 metre satellite imagery.
It also sets the file size, and the relationship isn’t gentle. Halve the cell size and you get four times as many cells. One square kilometre is 10,000 cells at 10 metres and a million cells at 1 metre. Cover the whole of England at 1 metre and you are past a hundred billion.
So finer isn’t automatically better. The useful question is how small the smallest thing you care about is, and then you pick a cell size comfortably below it.
Discrete vs continuous: why the data looks the way it does
The choice between vector and raster usually follows from whether the real-world thing is discrete or continuous.
Discrete data has a fixed identity and a real boundary. A building either exists at a location or it doesn’t. A land parcel has a defined edge set by a legal boundary. Discrete things fit vector well, because a polygon or a point is a boundary or a location.
Continuous data varies smoothly with no natural edge. Elevation doesn’t jump from one value to another at a particular line. It changes gradually across the landscape, and so do temperature, rainfall, and most environmental surfaces. Continuous things fit raster well, because a grid of cells can show gradual change far better than a set of shapes can.
| Discrete | Continuous | |
|---|---|---|
| Example | Building, parcel, road | Elevation, temperature, rainfall |
| Natural boundary | Yes | No |
| Typical format | Vector | Raster |
| Good question to ask of it | ”What is this, and where exactly?" | "How does this value change across the area?” |
There are exceptions. Land cover is often treated as discrete categories (woodland, water, urban) but stored as raster, because it comes from satellite imagery and is classified afterwards. Contour lines go the other way: they are vector lines describing a continuous surface. The rule of thumb holds most of the time.
What each one is good and bad at
| Vector | Raster | |
|---|---|---|
| Precision | Exact coordinates | Limited by cell size |
| Zooming in | Stays sharp | Turns into visible squares |
| Attributes | Many per feature | One value per cell, per band |
| File size | Grows with the number and detail of features | Grows with area and resolution |
| Good at | Boundaries, networks, ownership, measuring lengths and areas | Terrain, imagery, surfaces, combining many layers cell by cell |
| Weak at | Showing gradual change | Showing exact edges and thin features |
How to tell which one you’re looking at
If you’ve been handed a file and aren’t sure, three checks usually settle it:
- Zoom in a long way. If the edges stay crisp, it’s vector. If you start to see squares, it’s raster.
- Click on something. If you get a table of attributes for one feature, it’s vector. If you get a single number for that spot, it’s raster.
- Look at the file type. Shapefile, GeoPackage, GeoJSON and KML are usually vector. GeoTIFF, JPEG 2000 and ASCII grid files are raster.
Converting between the two
You can turn vector into raster (rasterising) and raster into vector (vectorising). Both are everyday operations, and both lose something.
Rasterise a boundary and its clean edge becomes a staircase, because each cell has to be either in or out. Vectorise a raster and you get polygons with stepped edges that look precise but are only as good as the cells they came from.
The second one causes more trouble. A boundary traced from 10 metre imagery can be drawn to the nearest centimetre in the software. It is still only good to about 10 metres. Converting it to vector hasn’t made it more accurate. It has only made it look that way.
Mistakes worth avoiding
- Treating a traced line as a surveyed one. If a boundary was digitised from an aerial photo, record that, and don’t use it for anything that needs survey accuracy.
- Choosing a cell size by default. Rasterise at whatever the software suggests and small features can vanish without any warning.
- Mixing resolutions without noticing. Combine a 1 metre layer with a 50 metre one and the answer is only as good as the 50 metre layer.
- Forgetting the coordinate system. Vector and raster layers have to share one before they will line up, which is the subject of What is a map projection?
- Storing everything at the finest resolution available. It feels safe, and it produces files nobody can open.
Using both together
In practice, most GIS projects use both, layered together. Take a solar site feasibility study, the kind of work we describe in renewable energy site selection with GIS. It typically goes something like this:
- Start with a raster of elevation and calculate slope from it, which gives a second raster.
- Reclassify the slope raster into two values: flat enough, and too steep.
- Vectorise the “flat enough” cells into polygons.
- Overlay those polygons on the vector land parcels, and remove anything inside vector constraint layers such as flood zones or protected sites.
- Measure what’s left. Areas and distances to the nearest grid connection point come from the vector layers.
The terrain questions are answered in raster. The ownership, constraint and distance questions are answered in vector. Neither format replaces the other.
If you’re not sure which format your project needs, that’s usually a sign it’s worth a conversation before you start collecting data, not after. Get in touch if you want a second opinion on how to structure a dataset before it becomes expensive to fix.